AstPy-001 Intro Activities

A series of 10 intro activities (4 of which are live) to introduce students to Python, NumPy, Pandas, Matplotlib and other useful modules.
AstPy-002 Intermediate Intro Activities
COMING SOON - A series of 10 activities to introduce students to intermediate topics in Python.
AstPy-003 Stellar Fusion
Introduces the atomic mass unit. Students calculate nuclear binding energies, mass defects, and mass excesses. Contains nuclear data (masses and binding energies) from the Atomic Mass Data Center.
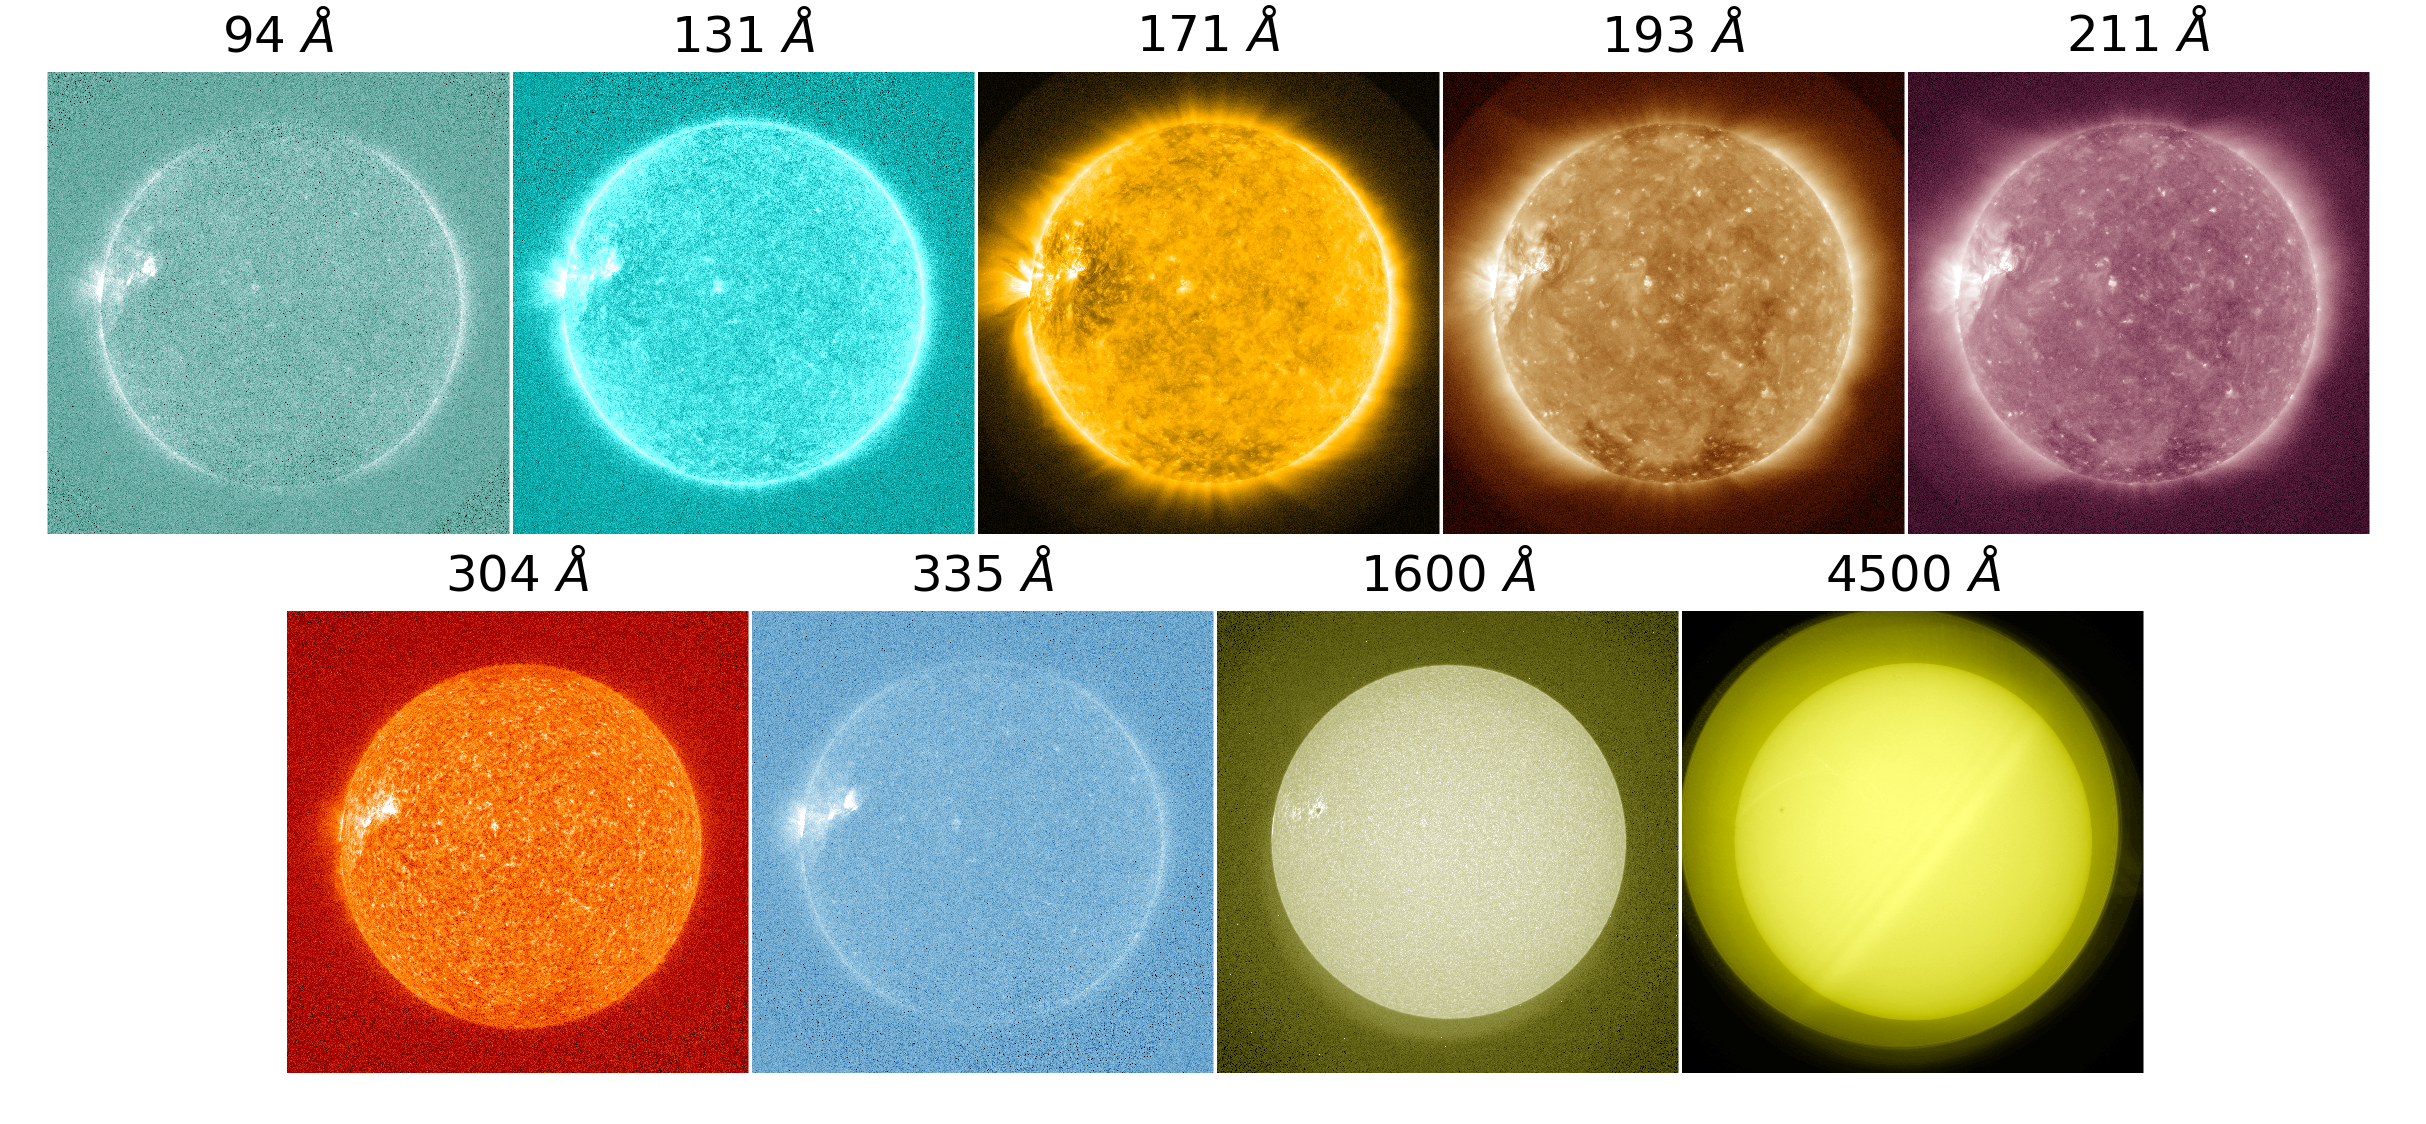
AstPy-004 Solar Images
Students use the SunPy module to explore the sun in different wavelengths and can download an image of the sun taken on today's date. Both SDO and SOHO images are explored as well as the sunspot cycle and flares. Some SDO HMI and AIA FITS files are provided.
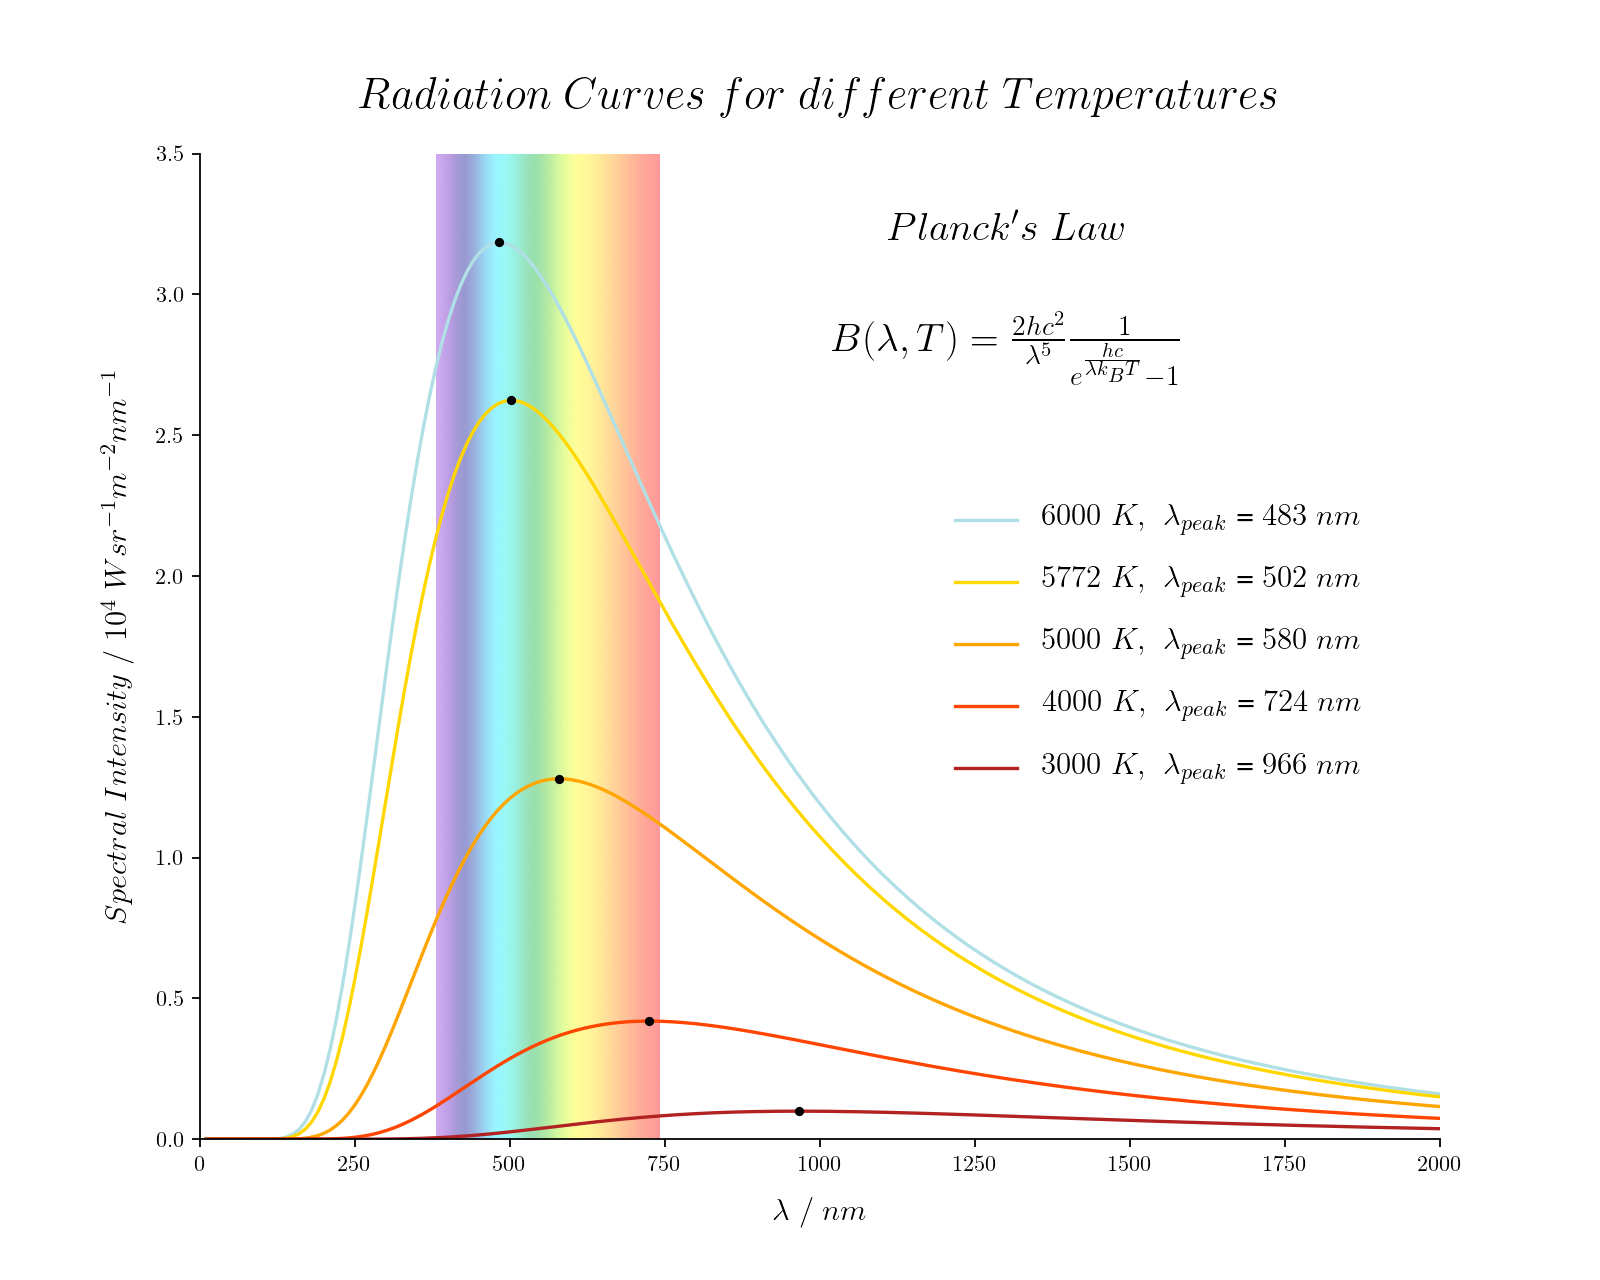
AstPy-005 Solar Radiation
Students are introduced to the blackbody curve, Wien's law, and the effective temperature of planets.
AstPy-006 Sunspots
Students track sunspots across the face of the sun and use that information to calculate the sidereal and synodic rotation rate of the sun. There is also code here that attempts to automatically detect and track sunspots.
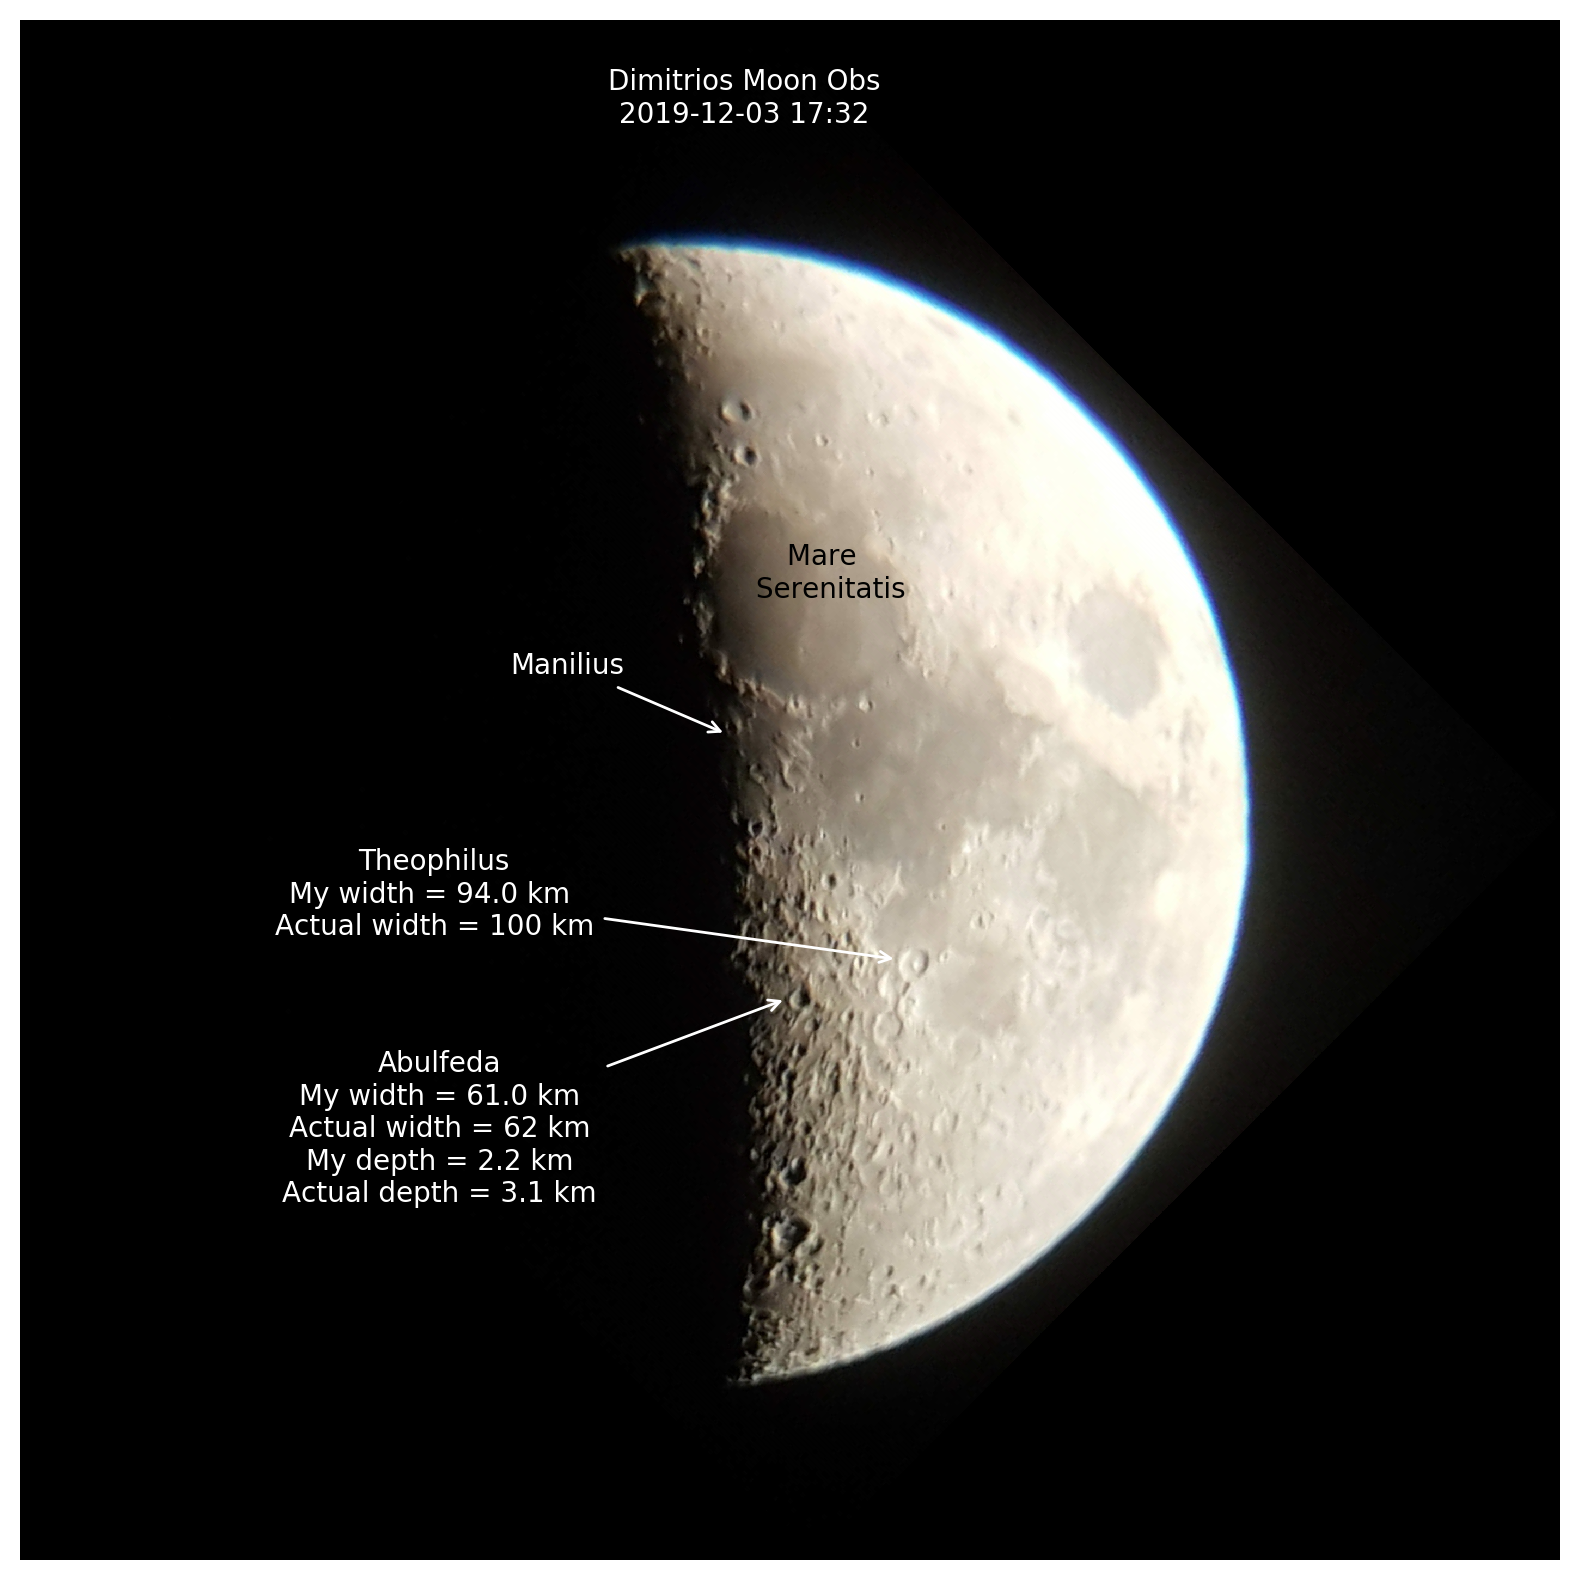
AstPy-007 Lunar Surface
Students upload an image of the moon they took and then annotate it. From the image they calculate sizes and depths of craters using the SkyField package. Requires students to calcualte the resolution of their telescope (or camera). They can then compare their image to known data and the included Lunar Reconnaissance Orbiter (LRO) and Lunar Orbiter Laser Altimeter (LOLA) data.
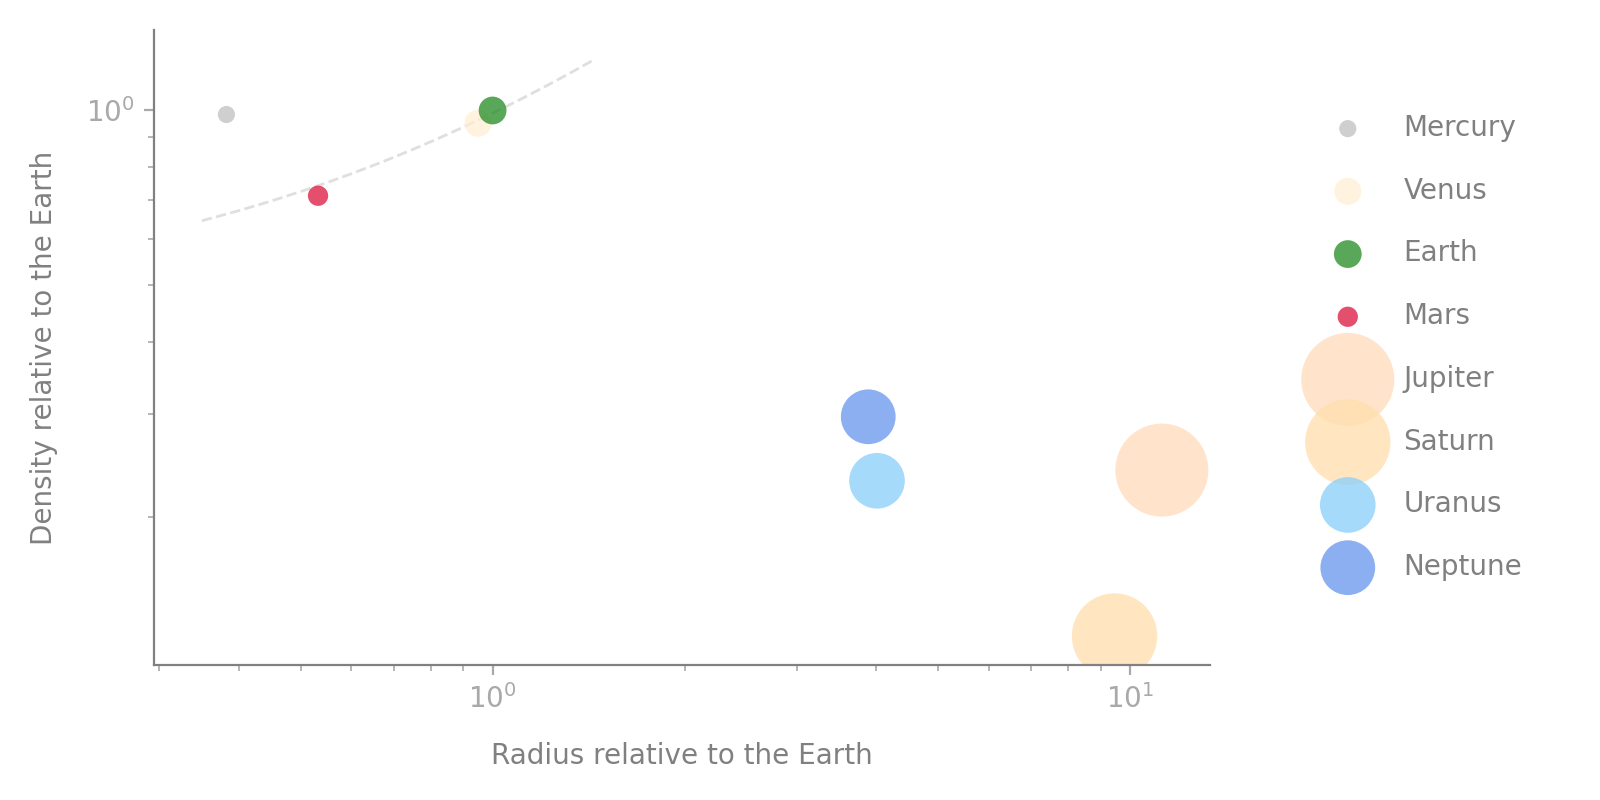
AstPy-008 Planets
Students compare data from the NASA planetary factsheet such as mass and radius and try and identify trends/groupings. The end of the assignment introduces students to exoplanet detection and observational biases.
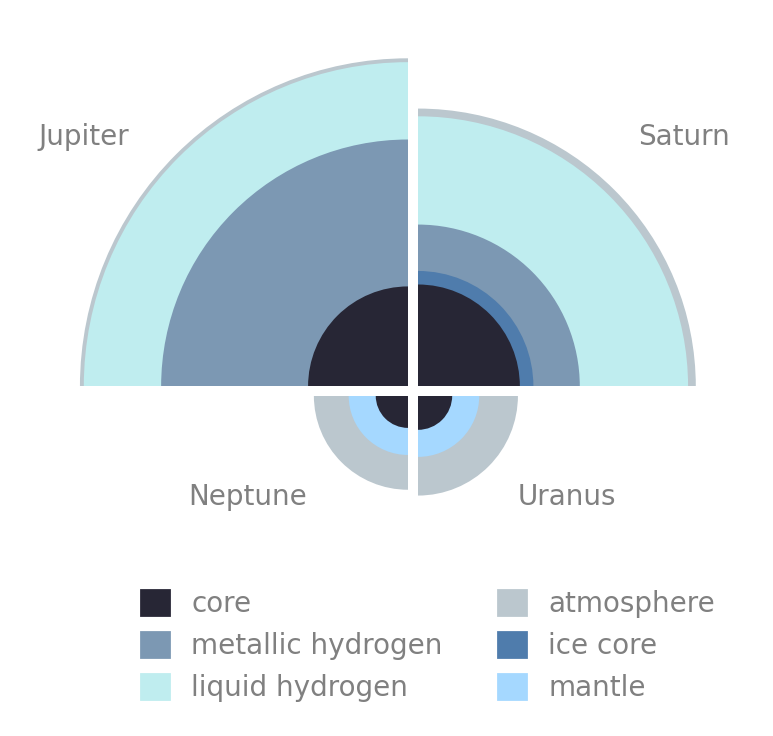
AstPy-009 Planetary Interiors
Students compare data on the interior compositions of the planets. They learn about compositional and mechanical layers and visualise the chemical composition of the Earth's crust.
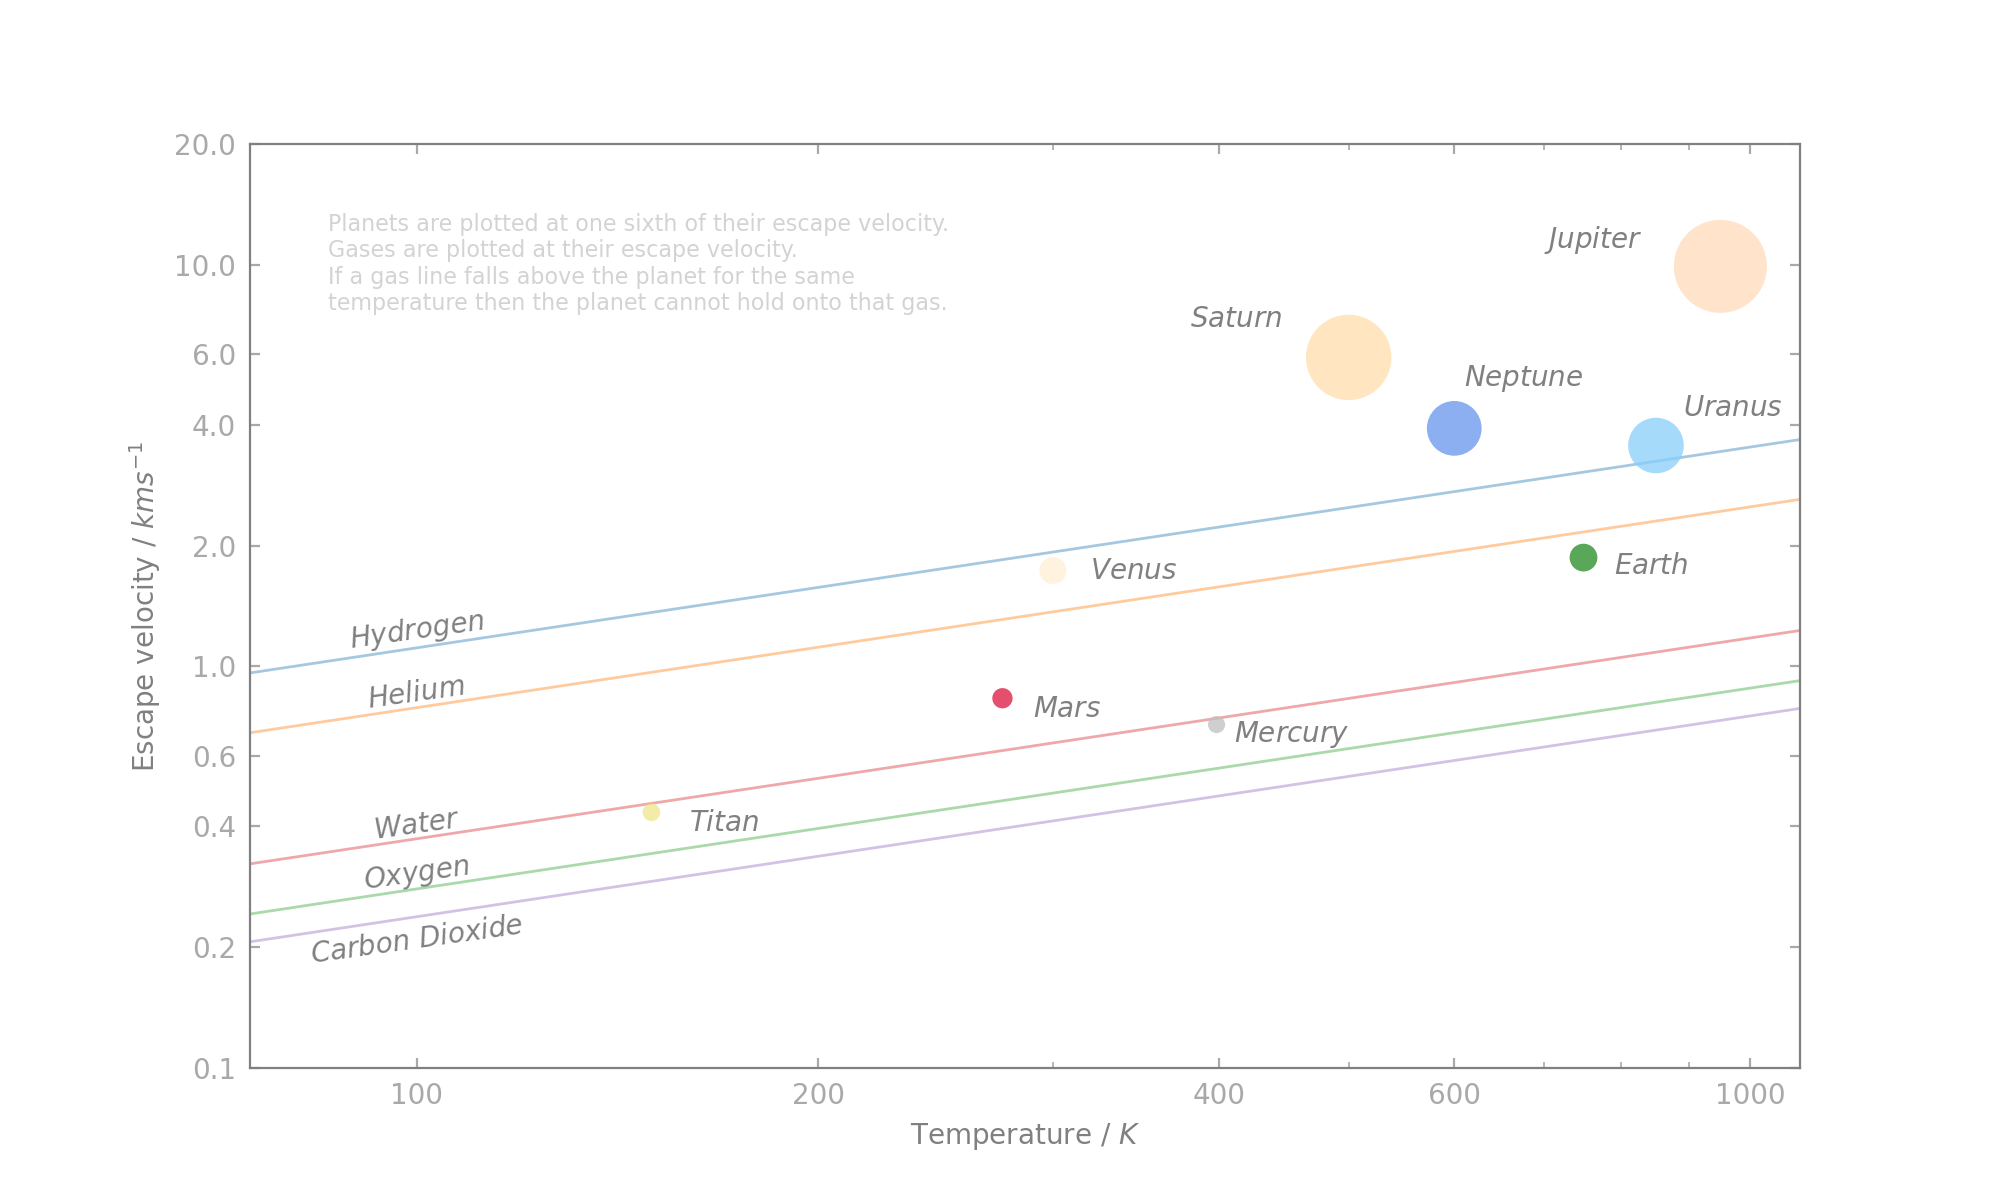
AstPy-010 Planetary Atmospheres
Students compare data on the chemical composition of planetary atmospheres. They can also calculate the escape velocity of some gases and work out whether those gases can escape from the planets atmosphere.
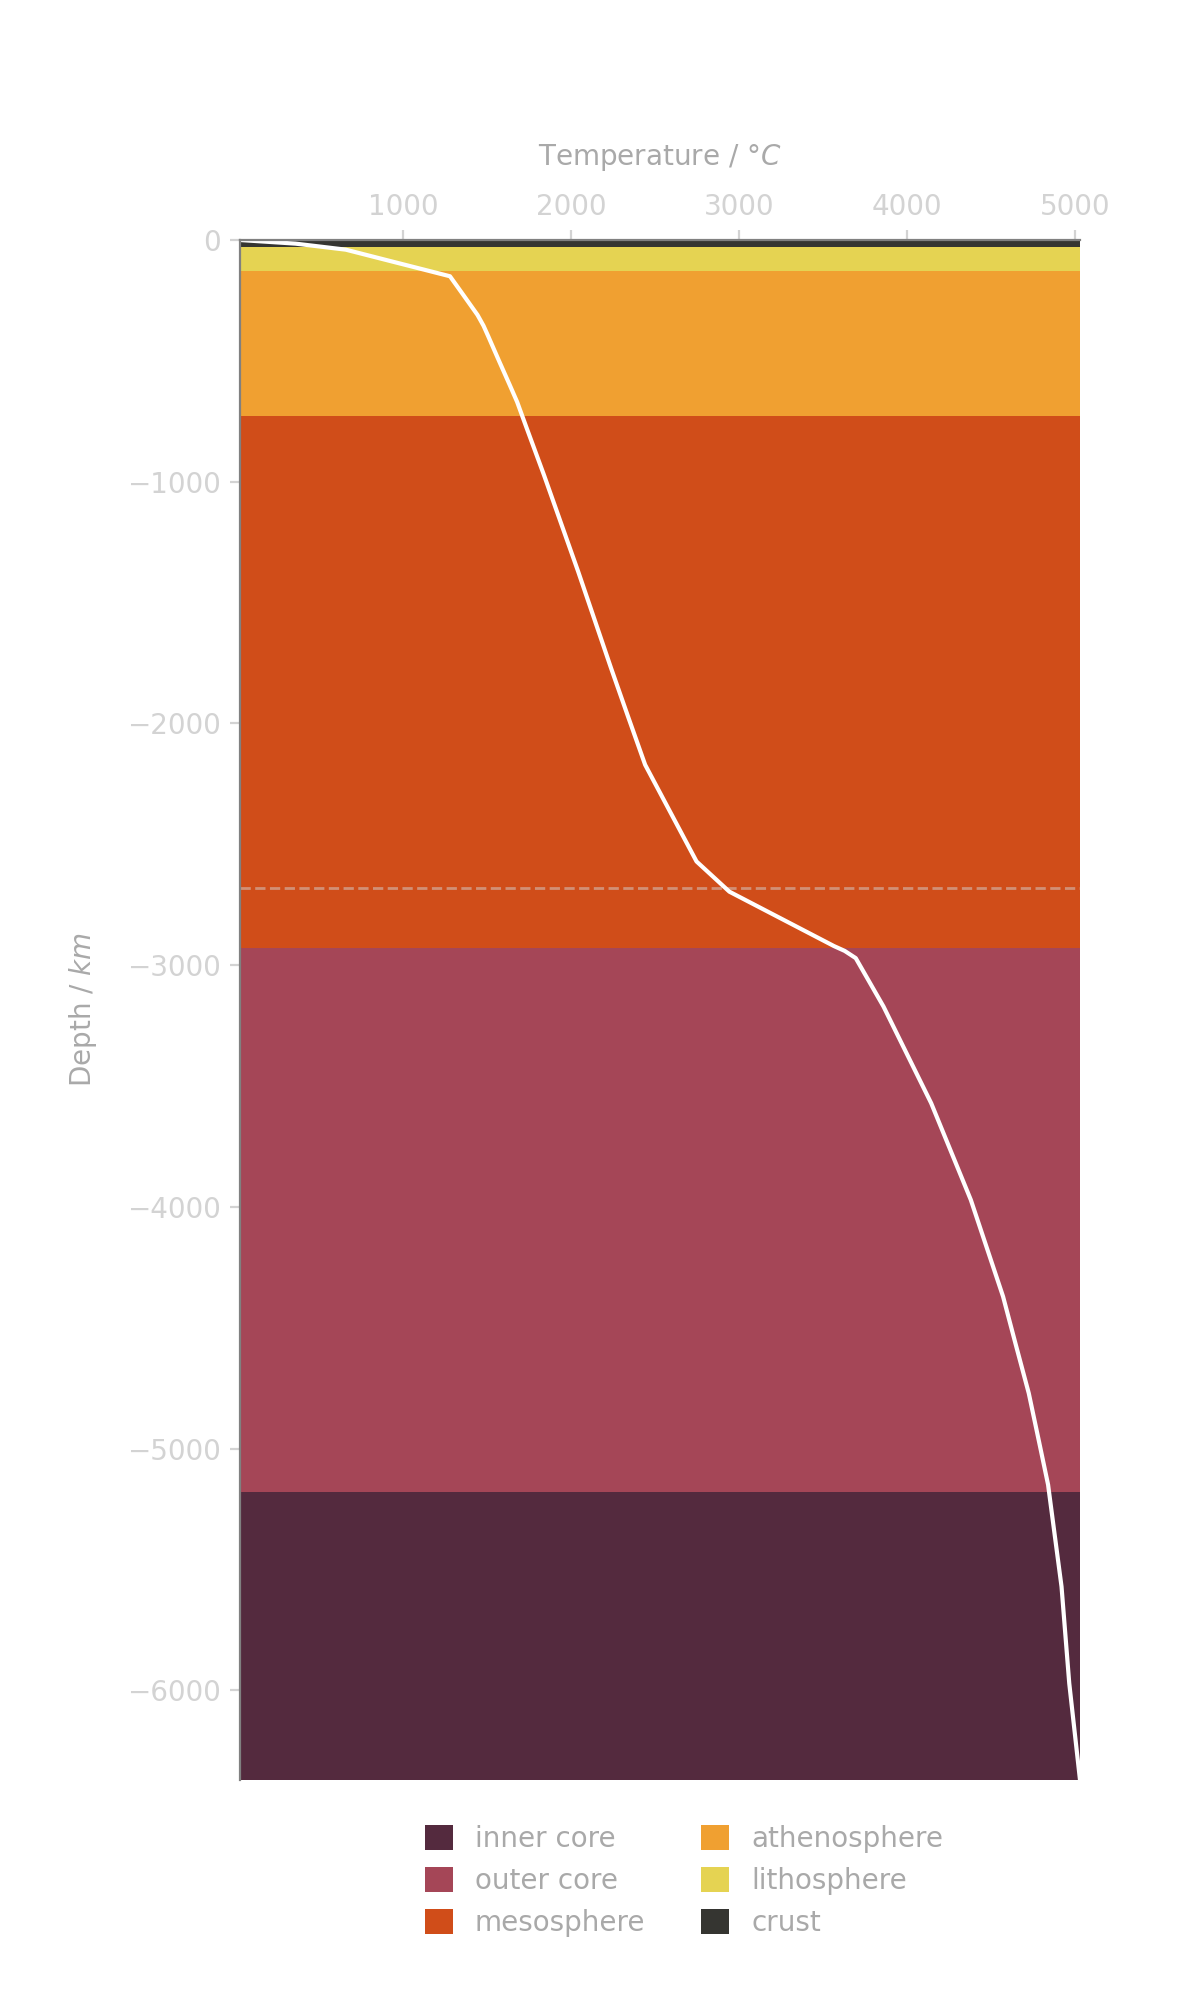
AstPy-011 Earth's Heat
Students model the geothermal gradient of the lithospehre and then plot the geotherm for the whole Earth. Students also calculate the energy transfer via conduction and latent heat.
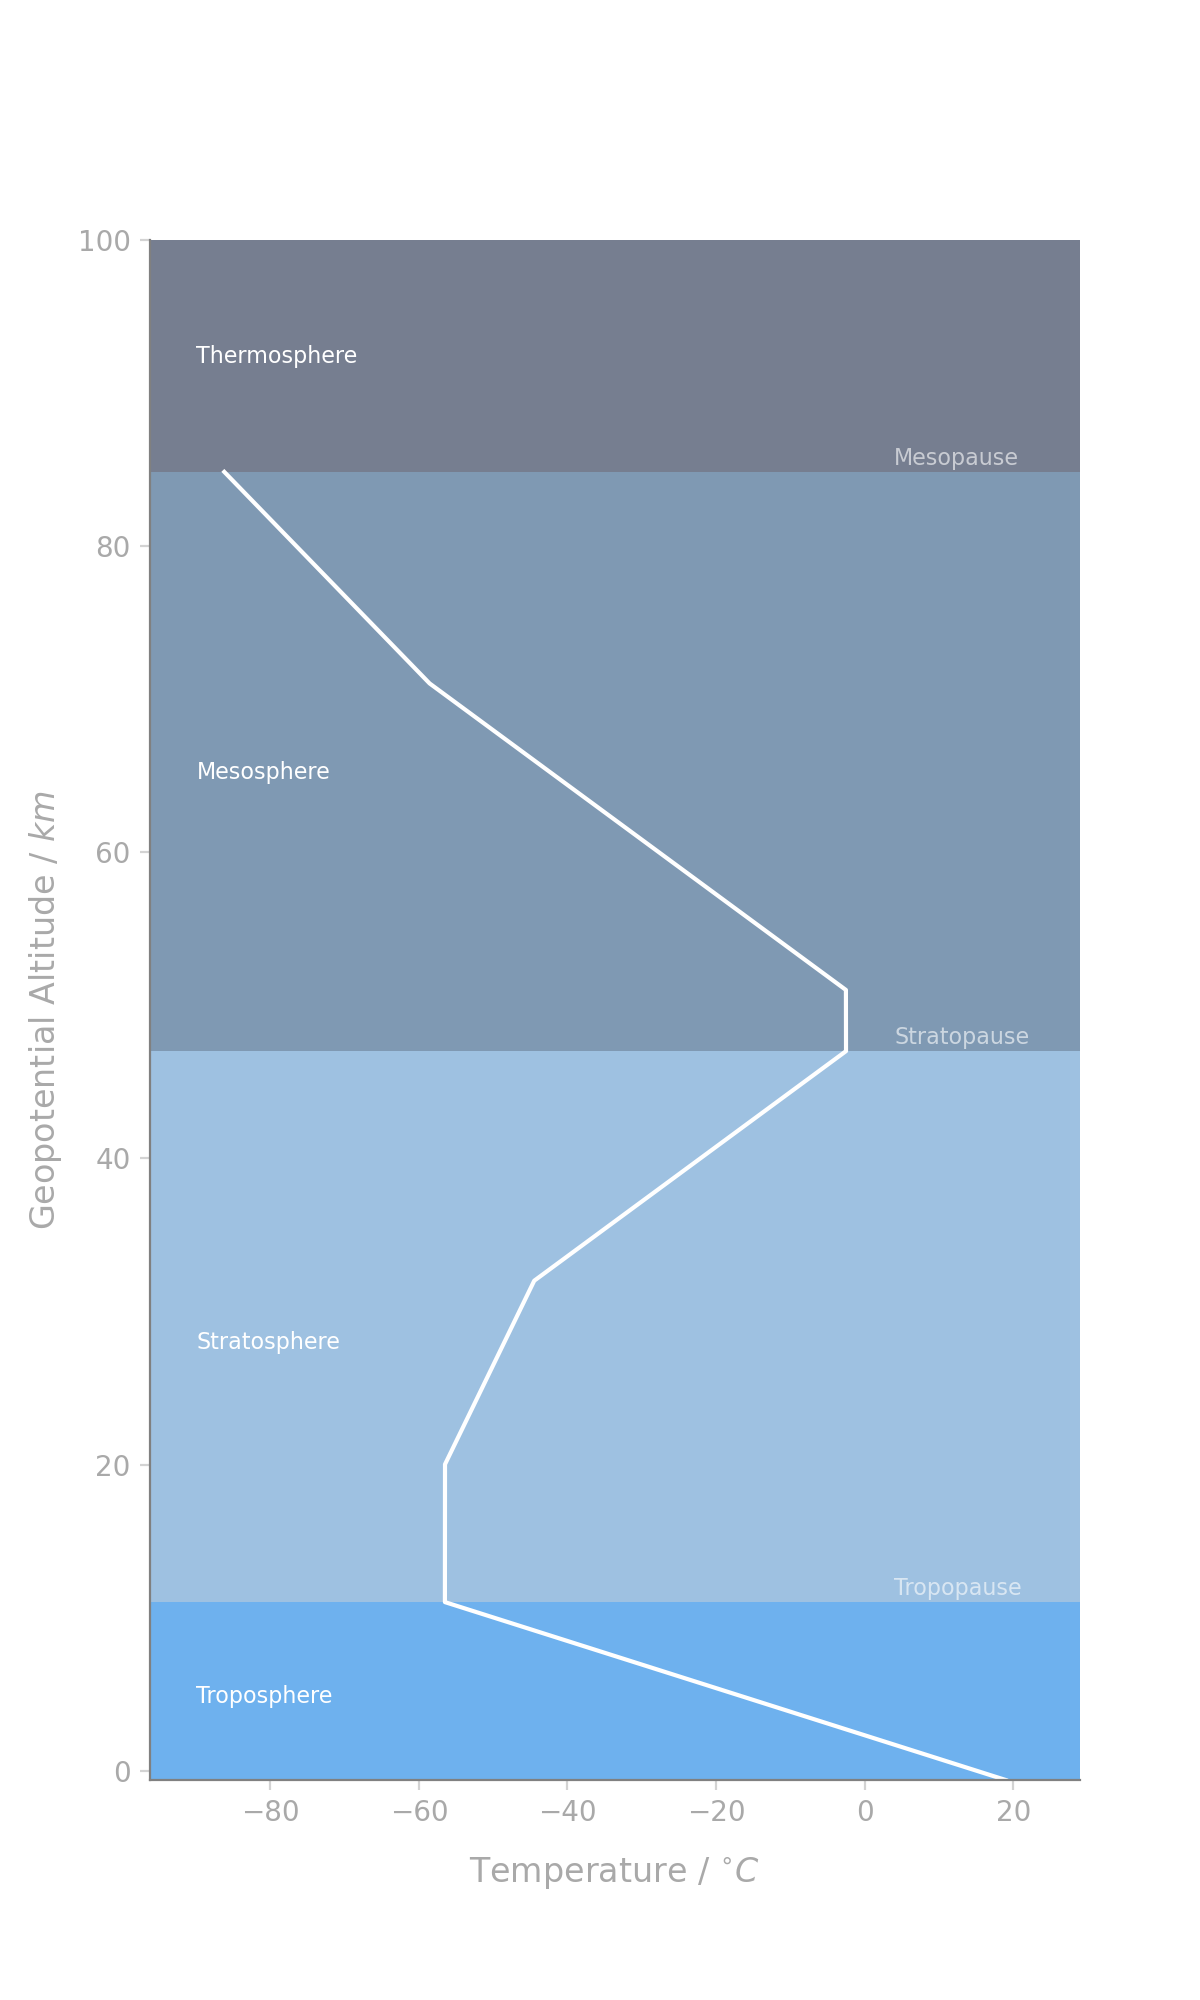
AstPy-012 Earth's Atmosphere
Students visualise how the temperature, pressure, density, and speed of sound vary with geopotential altitude using the International Standard Atmosphere model. Temperatures are constructed from data but all other properties are calculated using the ideal gas law etc.
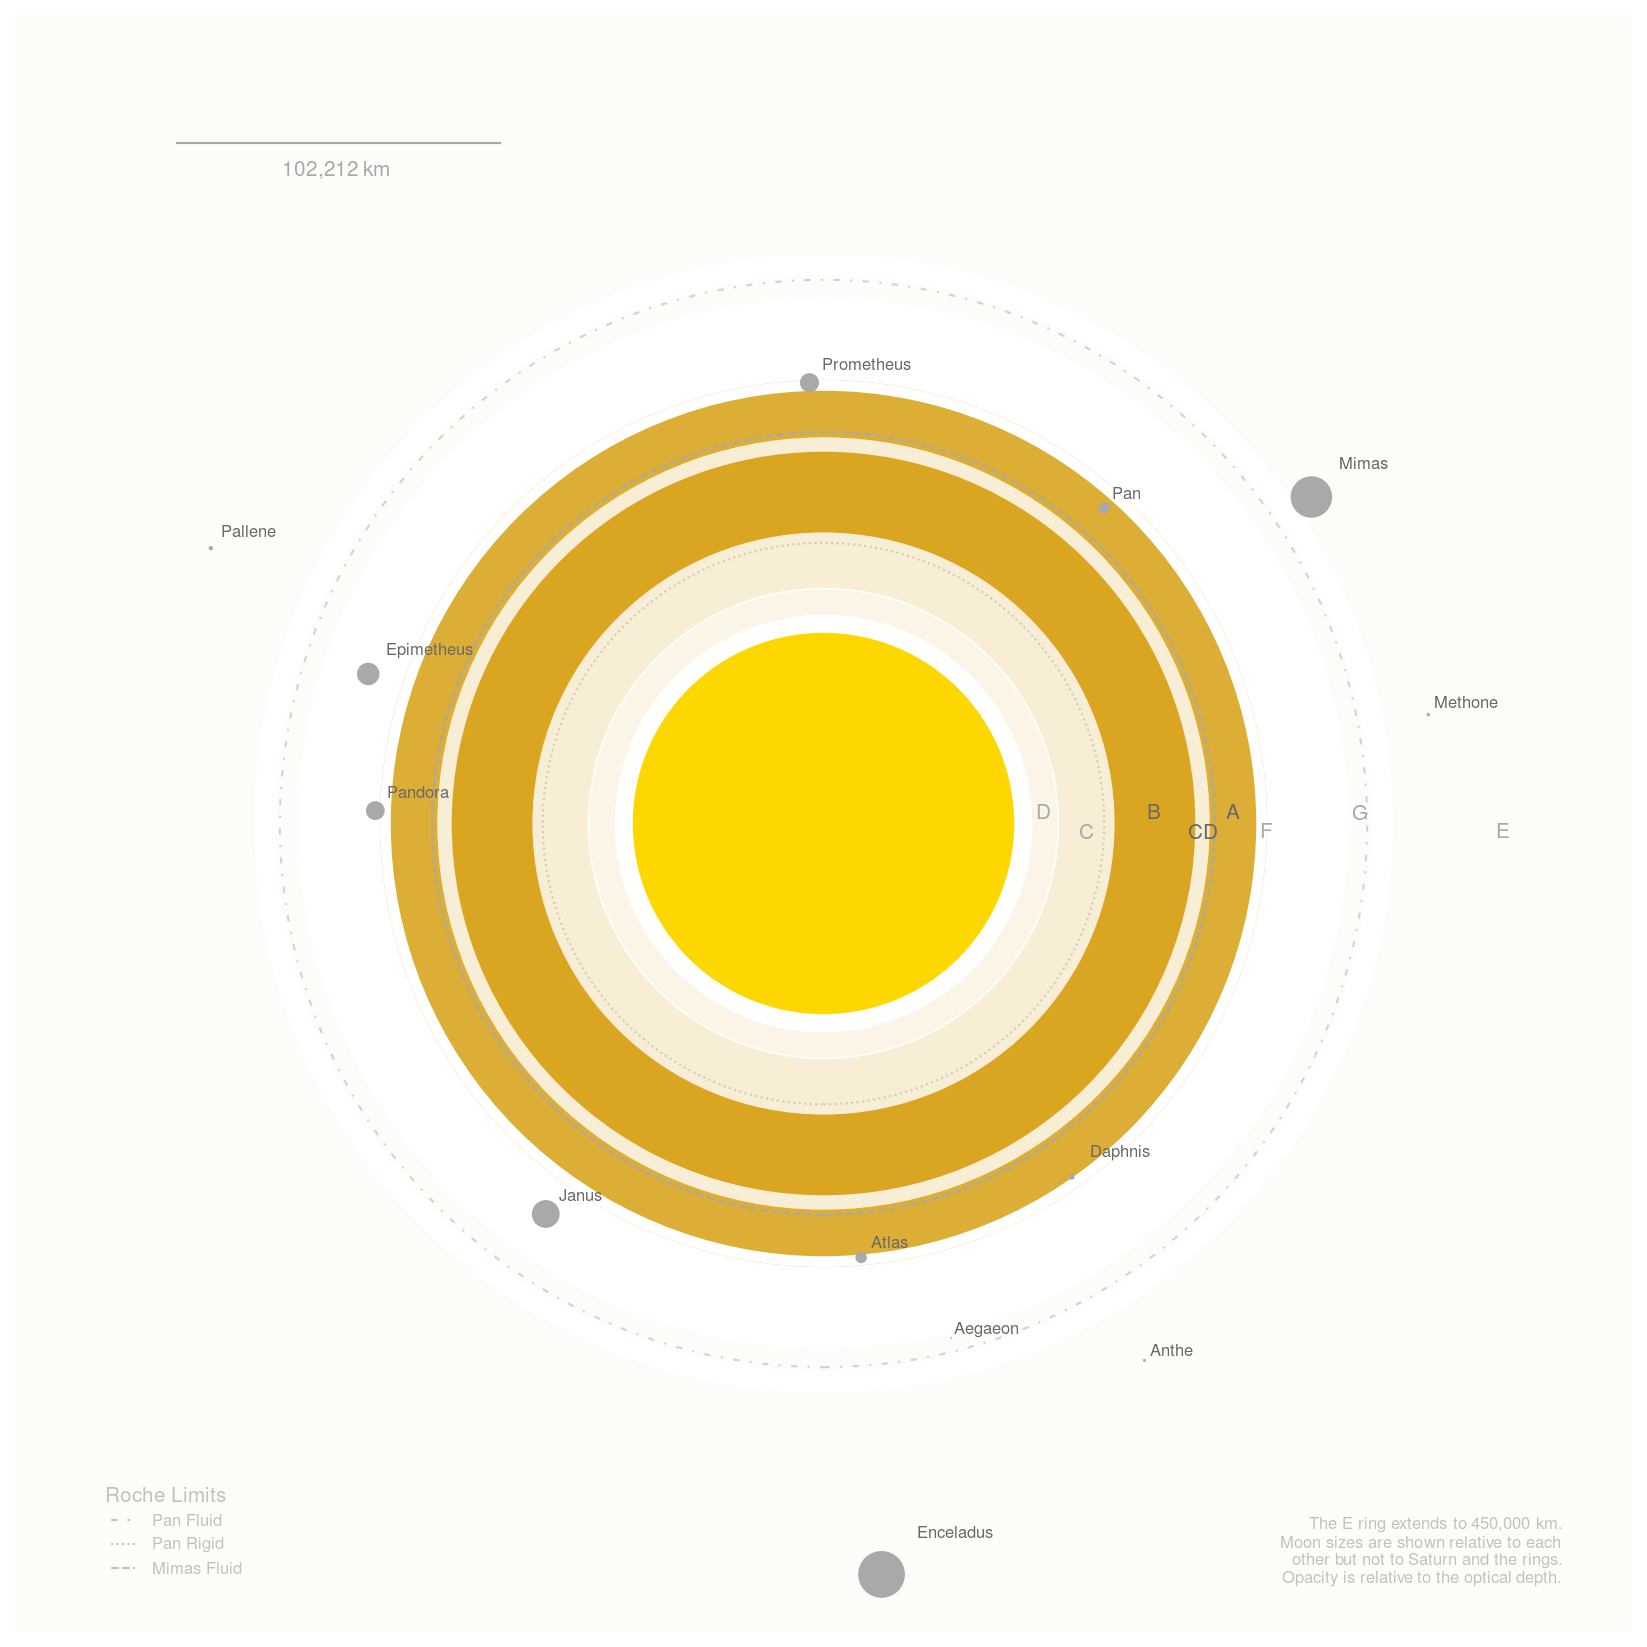
AstPy-014 Planetary Rings
Students visualise the rings of Saturn and then the other gas giants using data from the Ring-Moon Systems Node of the Planetary Data System. They plot the inner satellites on their figures along with their Roche limits (rigid and fluid) to see which moons are about to break up!
AstPy-015 Ring Dynamics
Students visualise the Roche limit using the N-body simulation package rebound. They calculate the location of resonances between moons and between moons and ring particles. Then they identify ring features associated with these resonances. Finally they look briefly at shepherd moons.
S001 Mars 2020 Launch Windows
To celebrate the landing of the Mars 2020 rover Perseverance students use basic algebra to calculate when the launch windows are for a Hohmann transfer orbit to Mars.
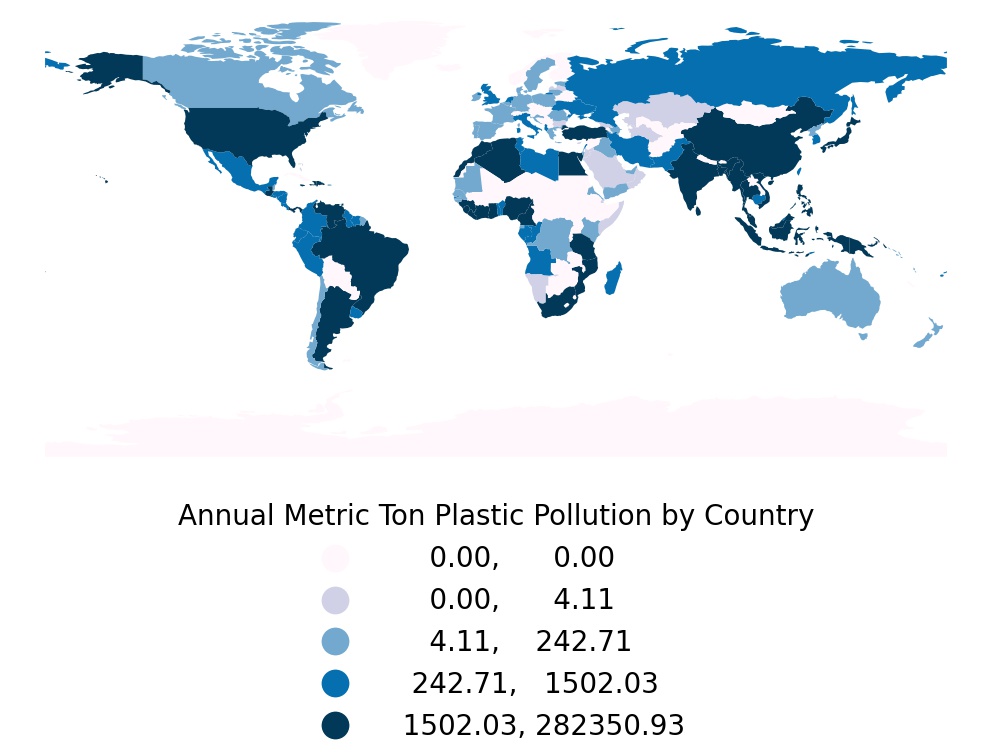
S002 Team Seas - River Pollution
Analyse plastic discharge by global and local rivers using data from the Ocean Cleanup Project.